

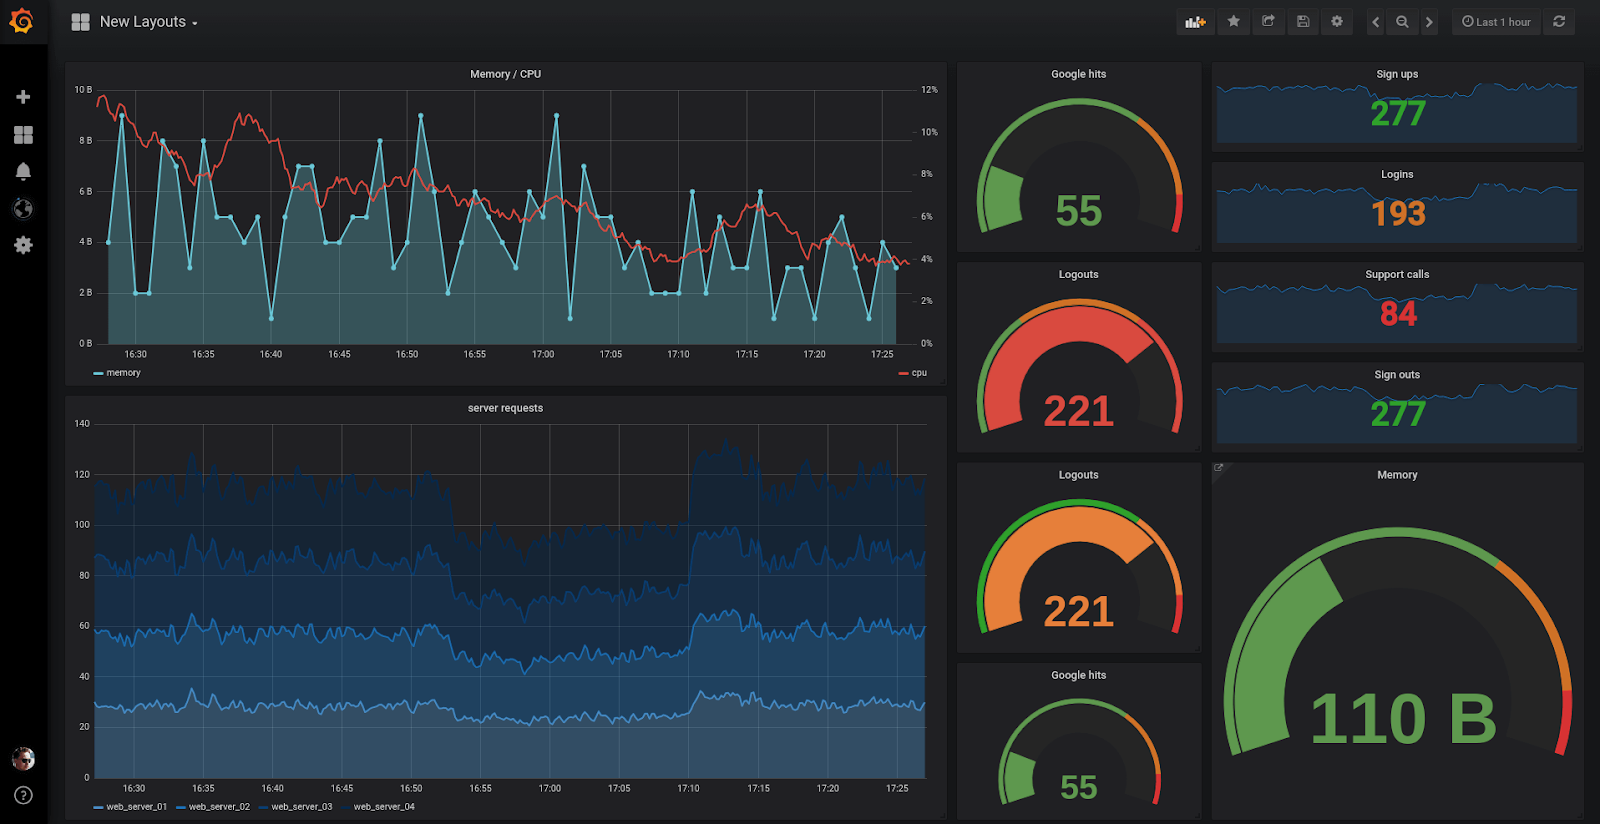
Monitoring Servers with Prometheus
Server monitoring is critical to maintaining uptime, performance, and reliability. This blog explores Prometheus, an open-source monitoring and alerting toolkit, explaining metrics collection, alert rules, and visualization with Grafana. It also covers best practices for monitoring applications, databases, and infrastructure, and integrating alerts with Slack or email. Proper monitoring ensures proactive issue detection, helping teams maintain robust and resilient systems.
Related Blogs

Introduction to Docker & Containers
Server & DevOpsDocker and containerization have transformed how applications are deployed and scaled. This article introduces Docker...
Admin
Mar 25, 2026
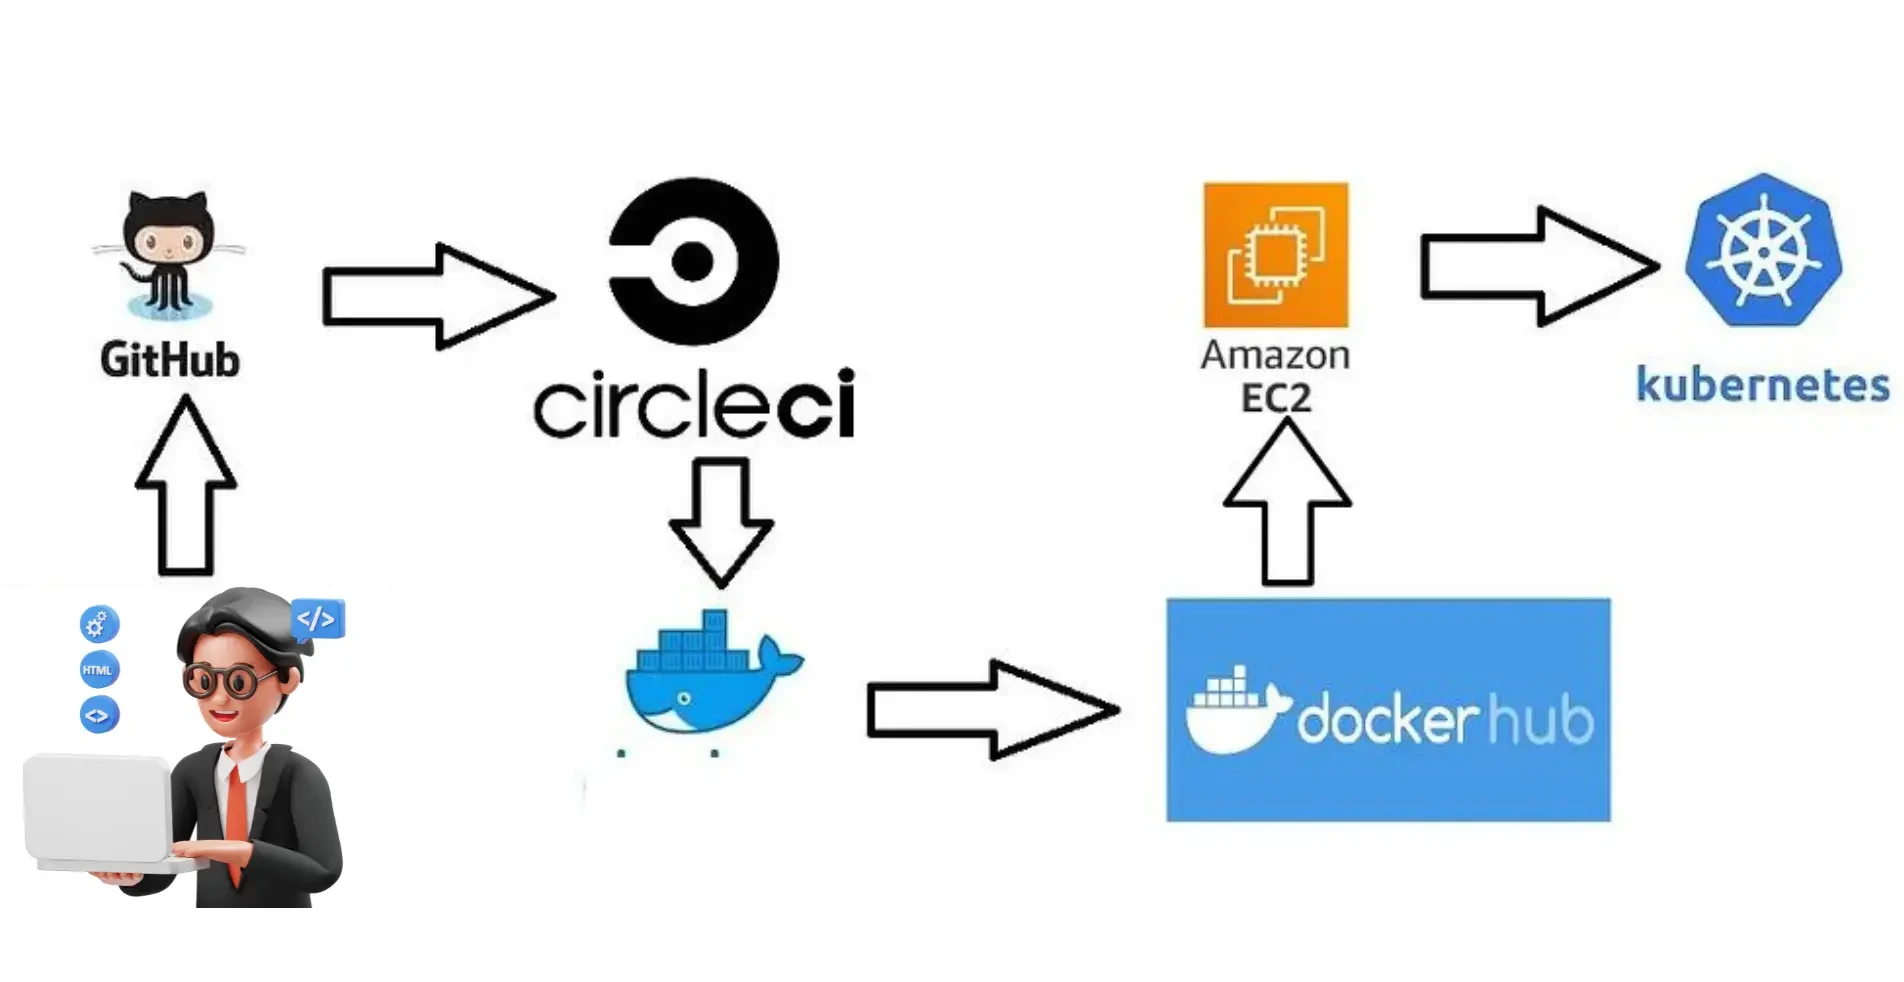
Setting Up a CI/CD Pipeline
Server & DevOpsContinuous Integration and Continuous Deployment (CI/CD) are essential practices in modern software development to en...
Admin
Mar 25, 2026